Managing a facility’s energy consumption is no easy task.
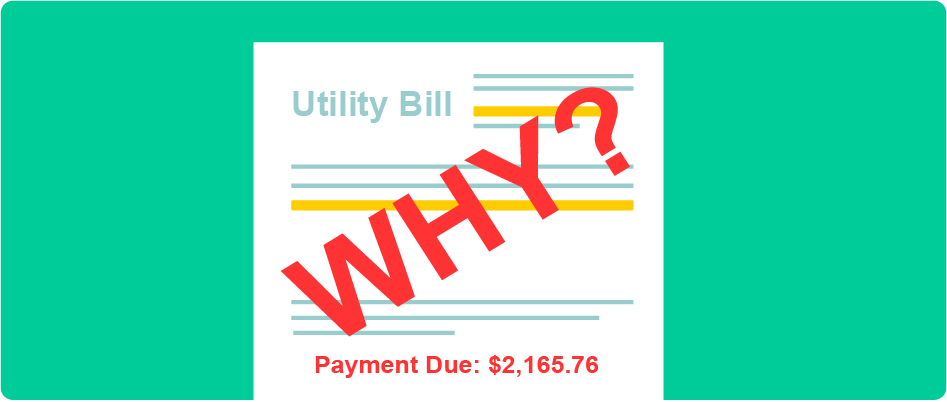
How do you monitor your utility costs? Is there ever a time when you unexpectedly get a large bill in the mail? How do you handle this situation?
After you received a larger than expected utility bill, did you find yourself walking around your building trying to locate the energy consuming culprit? Was it an employee? Was it a piece of machinery? Did you leave something on overnight? Finding the culprit becomes a guessing game.
The worst part of the guessing game is that you are not sure if you accurately detected the energy consuming culprit until the next bill comes in the mail. Maybe you got lucky, and your bill went back down. However, the question remains, did you detect the culprit or did some other variable reduce your usage?
This guessing game can waste a lot of time and energy, and you know how the saying goes, “energy is money.”
Not having to play the guessing game is one of the many benefits of using interval data. Interval data is used to determine how much electrical energy a facility is using over a given period of time. Utility providers also call intervals, “buckets.” Monitoring interval data provides the ability to detect energy consumption problems before a large bill comes in the mail. Interval data helps you visually identify when there is a spike in consumption and stop it. Furthermore, you don’t have to wait for your bill to arrive to determine if you made the correct energy reducing decision. You can see if you made the correct decision in as little as 15 minutes, depending on your meter’s time interval setup.
Interval utility data is based on your meters capabilities and typically comes in time intervals ranging from 15 minutes to daily.
You can see how UtilityMVP uses interval data by signing up for a FREE 3 MONTH TRIAL at utilitymvp.com. Click on the education tab to learn more ways to improve your facilities energy usage.

